For one of my projects we need to extract realtime data from Cisco ASA firewalls. Cisco already provides a REST agent for ASA Firewalls since 2014-ish. The REST agent provided a mean to make CRUD operations (Change, Read, Update and Delete), but will not be your explicit way of access. Other programs like SSH or ASDM will still be available and provide a way of changing the configuration. Also bare in mind that the REST API will gain access to the running configuration. You’ll need to provide an additional way of writing to the startup configuration.
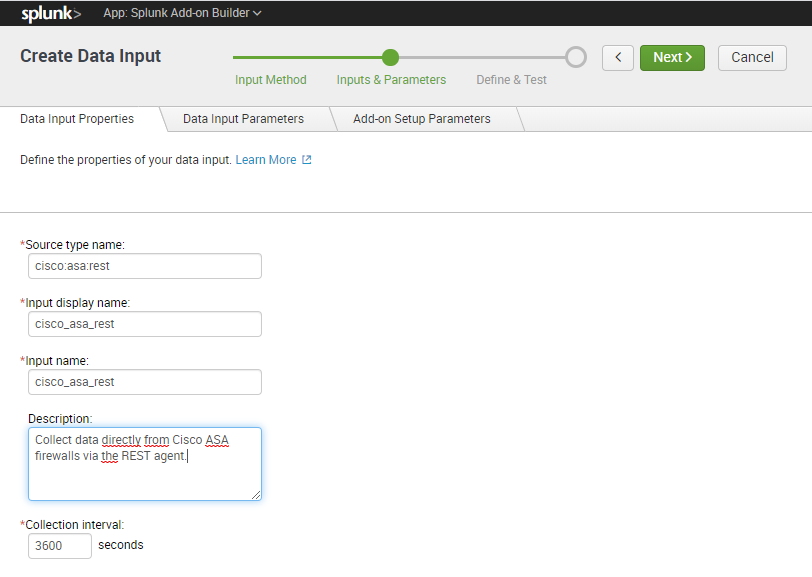
This post is going to dive into the initial setup and test extractions in Splunk with the Add-on Builder. With this app we can create a Technology-addon and create new data inputs with Event extractions. In the resources section below I’ve sum up the collected resources.
:: Setup
To fully focus on what we want to achieve I’ve made a simple but effective setup. See the diagram below:
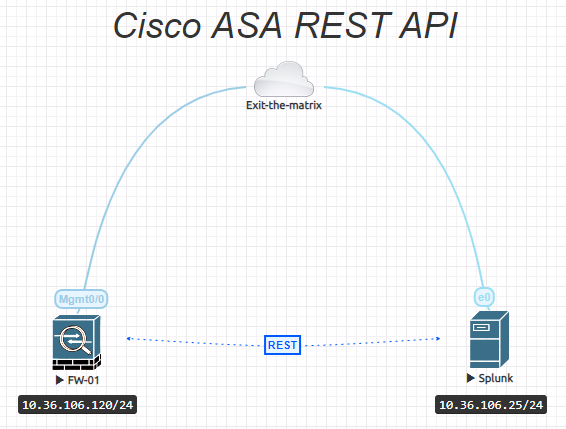
| Name | Version |
| Cisco ASAv | 9.5.2-204 |
| CentOS Linux | 8.0 |
| Splunk Enterprise Evaluation | 8.0.4.1 |
| Splunk Common Information Model (CIM) | 4.16.0 |
| Splunk Add-on Builder | 3.0.1 |
| Cisco ASA REST API agent | 7141-lfbff-k8 |
:: Prepare Cisco ASA
To enable the REST agent you will need to have some configuration in place. In our setup we have a test ASAv with limited configuration and local authentication. In most cases production setups normally use tacacs/radius authentication and authorization. The REST authentication needs to be adjusted in order to use the correct authc/authz method. Also ASAv has the agent built into the Boot: partition, but let’s pretend we have a regular hardware ASA.
First you will need to upload the REST agent package. You can find this in the download section of the Cisco ASA firewall section. The filename somewhat reflect the following format: asa-restapi-{version}-lfbff-k8.SPA.
Some details to consider:
- Installation Multiple context: Install on admin context
- Installation on Single context (our case): Install on ASA directly
Transfer the package to your ASA via TFTP, SCP, SFTP or FTP. You can also use ASDM and the file manager to make it more easier to transfer files to the local file system.
!
http server enable
http 0.0.0.0 0.0.0.0 management
!
! >> For only GET operations Priv 5 is sufficient. For GET, PUT and DELETE operations Priv 15 is needed
username restapi password test1234 privilege 5
!
aaa authentication http console LOCAL
!
! >> Ensure correct routing towards the Splunk server. In our case we have the management interface and Splunk server in the same subnet for simplicity. No need for a route.
! route {interface} x.x.x.x y.y.y.y.y {next-hop}
!
! >> Install Rest API agent
rest-api image disk0:asa-restapi-7141-lfbff-k8.SPA
!
! Enable REST api agent
rest-api agent
!
end
wr
!
:: Verify
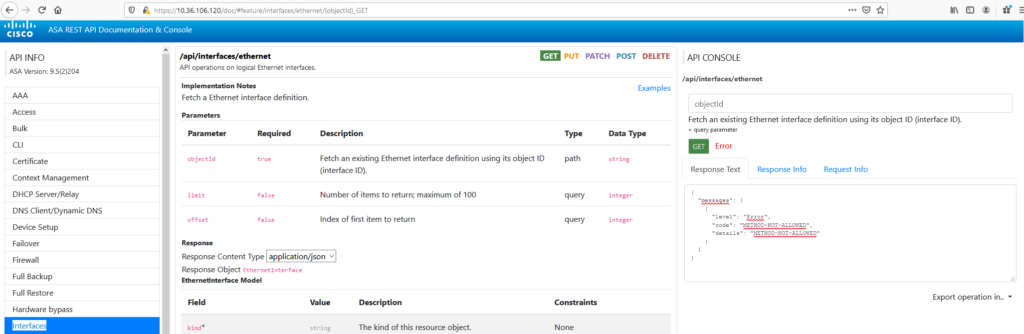
Check if the agent is installed correctly.
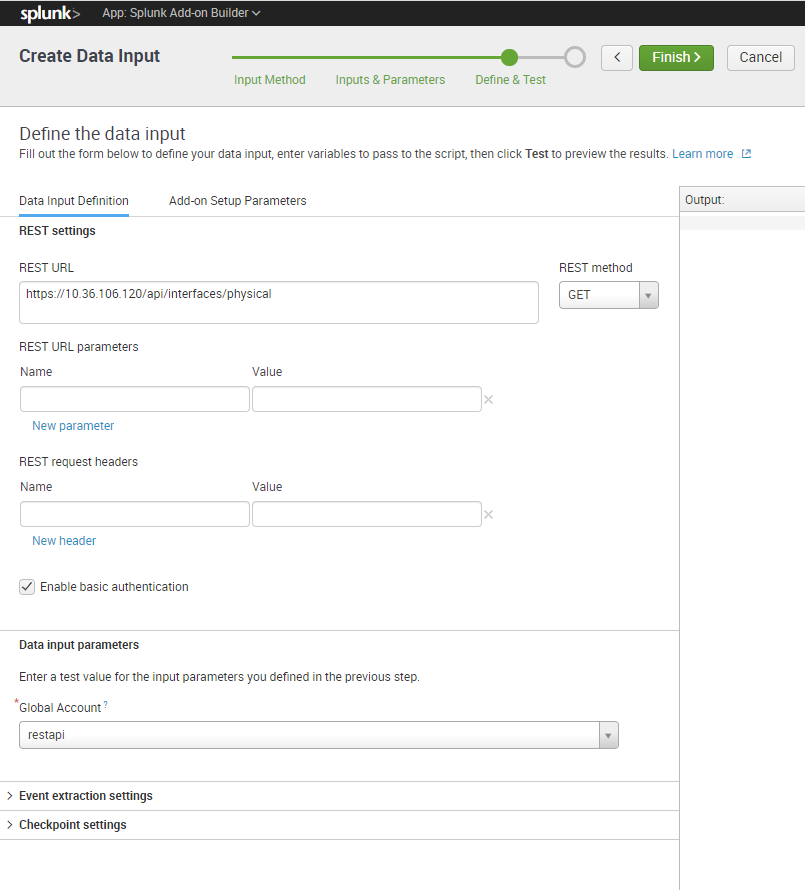
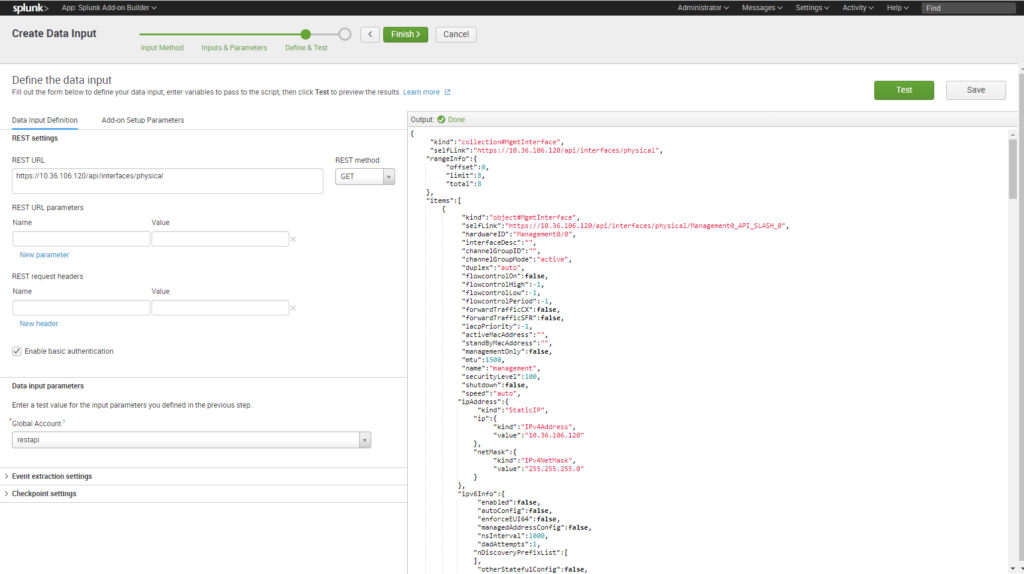
Go to URL: https://10.36.106.120/api/objects/networkobjects
The following should appear after login:
{"selfLink":"https://10.36.106.120/api/objects/networkobjects","rangeInfo":{"offset":0,"limit":0,"total":0},"items":[]}API documentation is included in the agent: https://10.36.106.120/doc/#
:: Splunk and the addon builder
There are a few thing you need to keep in mind as it come to data collection for network devices:
- Install Splunk eval
- Install Splunk Common Information Model
- Install Cisco ASA Technology add-on
- Install Splunk add-on builder
Never install the addon builder on distributed production setups. You must develop a TA in the standalone test environment, validate it and transfer the TA to the production environment.
This would provide you with sufficient field extractions and data models to get started immediately as it come to Network data.
Now back to the add-on builder…
Click Save and Finish
Go to created App:
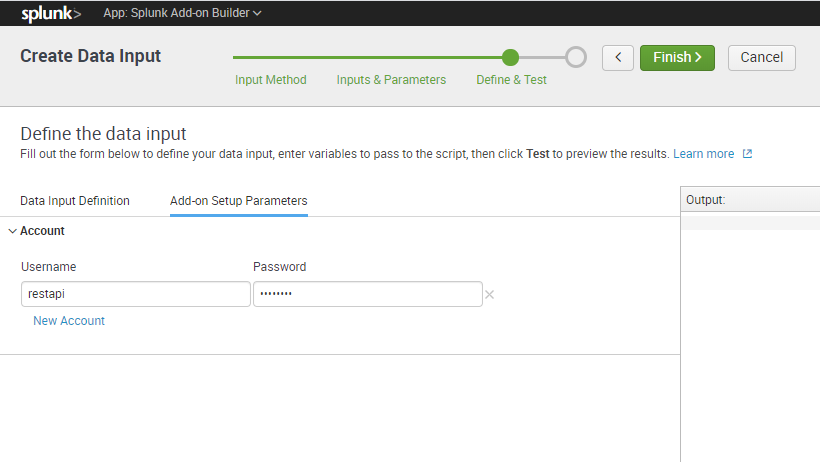
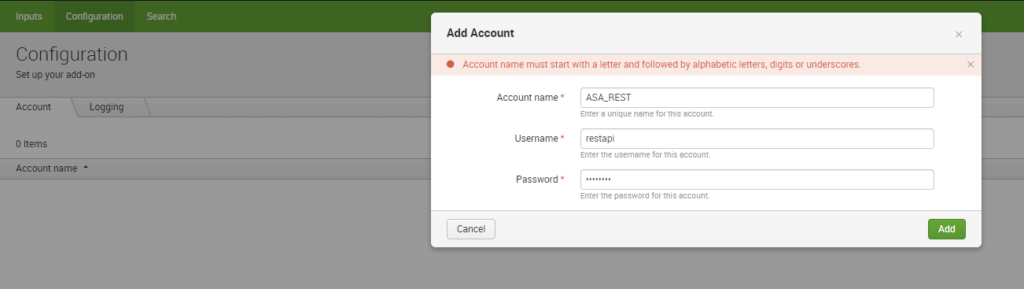
Select Configurations and setup your REST api account:
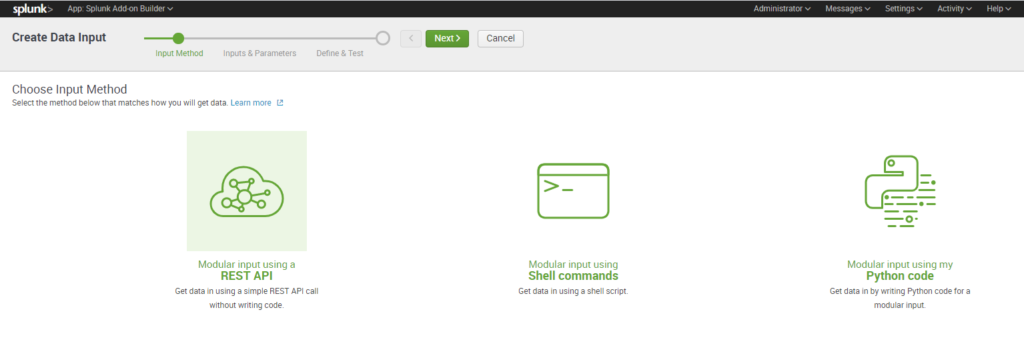
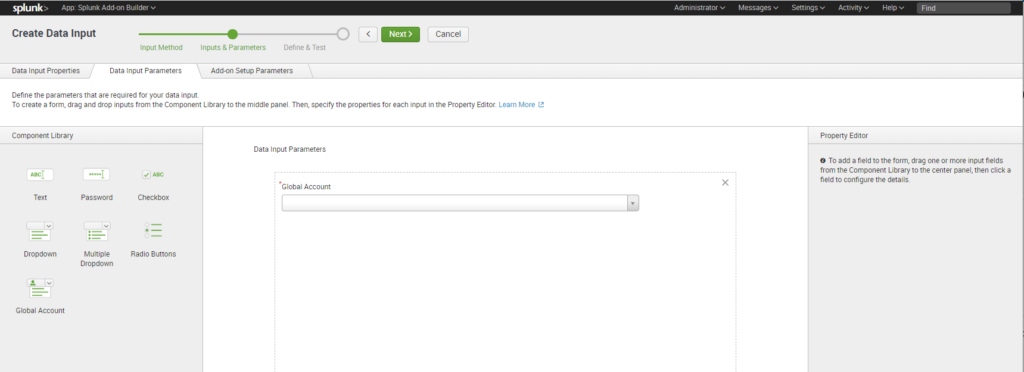
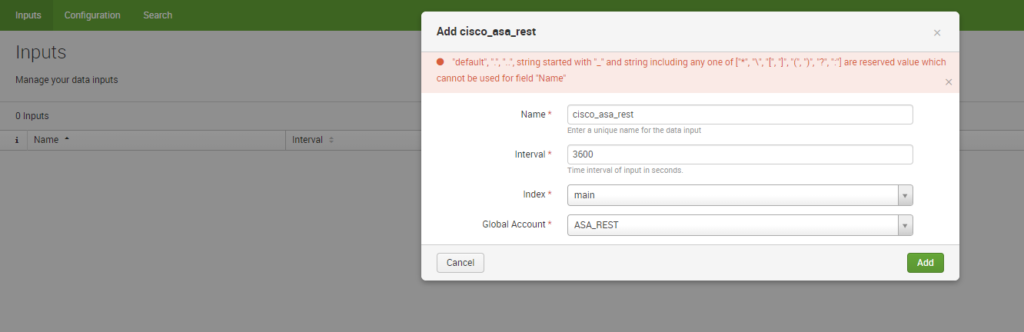
Go to Inputs and “Create new Input”
Restart SplunkWeb via Webgui or
Initiate from CLI:
[root@SPLK-01 /]# cd /opt/splunk/bin
[root@SPLK-01 bin]# ./splunk restart
Stopping splunkd...
Shutting down.  Please wait, as this may take a few minutes.
..                                                         [  OK  ]
Stopping splunk helpers...
                                                           [  OK  ]
Done.

Splunk> Finding your faults, just like mom.

Checking prerequisites...
        Checking http port [8000]: open
        Checking mgmt port [8089]: open
        Checking appserver port [127.0.0.1:8065]: open
        Checking kvstore port [8191]: open
        Checking configuration... Done.
        Checking critical directories...        Done
        Checking indexes...
                Validated: _audit _internal _introspection _metrics _metrics_rollup _telemetry _thefishbucket add_on_builder_index cim_modactions hi                           story main summary
        Done
        Checking filesystem compatibility...  Done
        Checking conf files for problems...
        Done
        Checking default conf files for edits...
        Validating installed files against hashes from '/opt/splunk/splunk-8.0.4.1-ab7a85abaa98-linux-2.6-x86_64-manifest'
        All installed files intact.
        Done
All preliminary checks passed.

Starting splunk server daemon (splunkd)...
Done
                                                           [  OK  ]

Waiting for web server at http://127.0.0.1:8000 to be available........................ Done


If you get stuck, we're here to help.
Look for answers here: http://docs.splunk.com

The Splunk web interface is at http://SPLK-01.testlab.local:8000
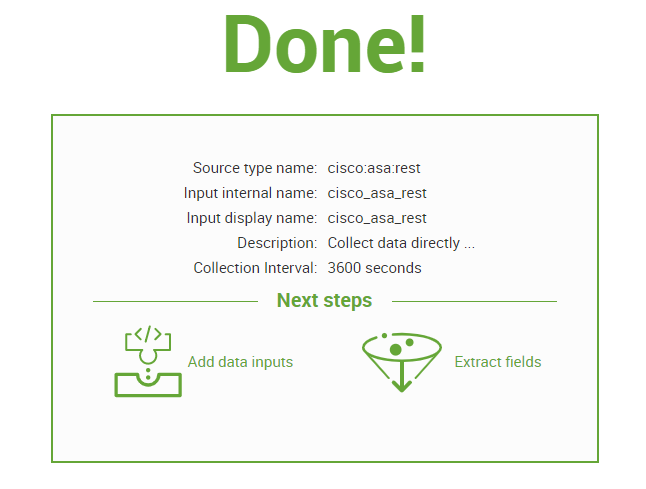
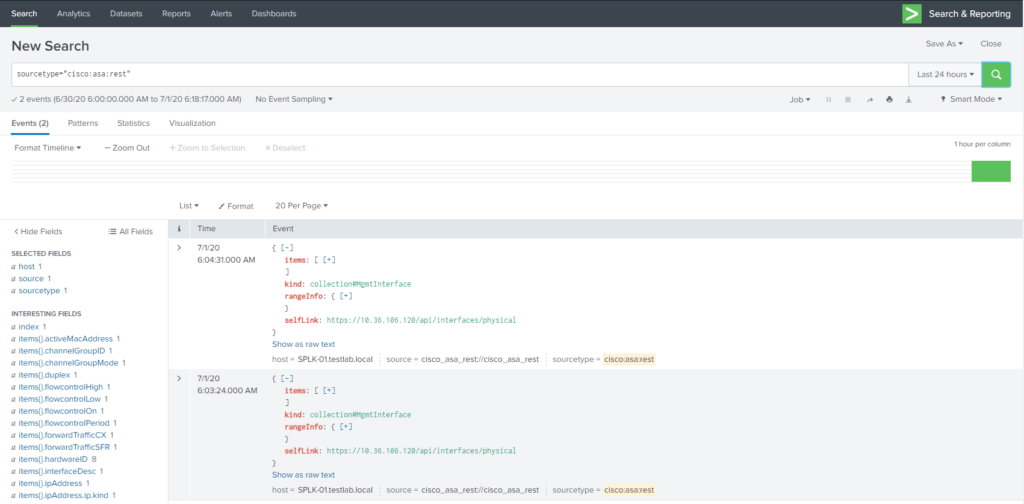
After restart go to the Search and Reporting app and enter “sourcetype=”cisco:asa:rest”” as your search to see the results.
:: Wrap up
This is the most simple way to get REST GET information inside Splunk. There still can be a requirement to format the data more to your needs by filtering out unnecessary data fields. Just keep it simple. I might add some more examples in the future to complement this post.