For my current role as a Security Consultant I need to create a lot of dashboards and Security Use Cases in Splunk. I’m pretty good at it, but not a specialist or Splunk Certified.
To keep on par with my progress I thought it was a good idea to use Splunk for progress tracking my study. I took the Exam Blueprint added a value count field and a progress field. Whenever I finish a topic I change the value from “0” to “100” from the input lookup. The percentage is calculated over the total amount of topics where progress equal “100” or does not equal “100”
Here is an example of the search for uncovered topics:
| inputlookup 300-415.csv
| stats count by progress
| eventstats sum(count) as progresscount
| eval percentage=(count/progresscount)*100
| search progress!=100
| stats by percentage
When we change “| search progress!=100″ to ” … progress=100″ we flip the search to all covered topics.
:: Let Splunk motivate you
In order to be motivated by something other than myself I use Splunk to compare progress results and add a text value. The below statement will complement the previous search. I’ve highlighted the evaluation based on percentages and the search based on progress=100:
| inputlookup 300-415.csv
| stats count by progress
| eventstats sum(count) as progresscount
| eval percentage=(count/progresscount)*100
| search progress=100
| stats by percentage
| eval test=if(percentage<20, “More study!”, if(percentage<40, “you’re getting there”, if(percentage<60, “Doin’ good!”, if(percentage<80, “Wow, almost there!!”, if(percentage<90, “Plan that exam! You’re ready, man!”, “ow fuck!”)))))
| table test
The eval will be presented in the top of the page.
:: Results
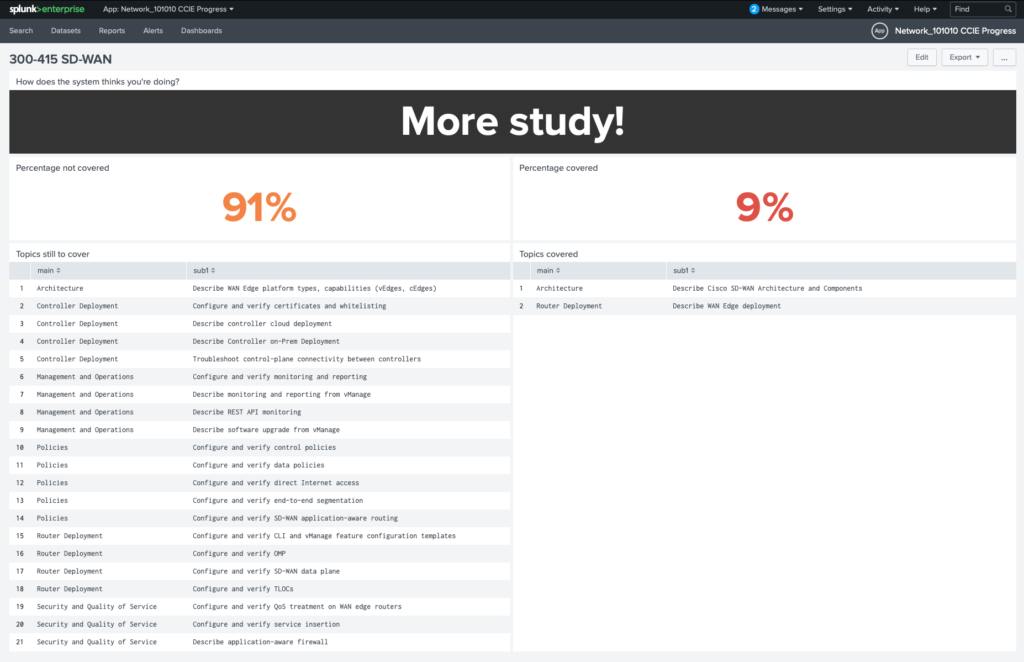
Start of study:

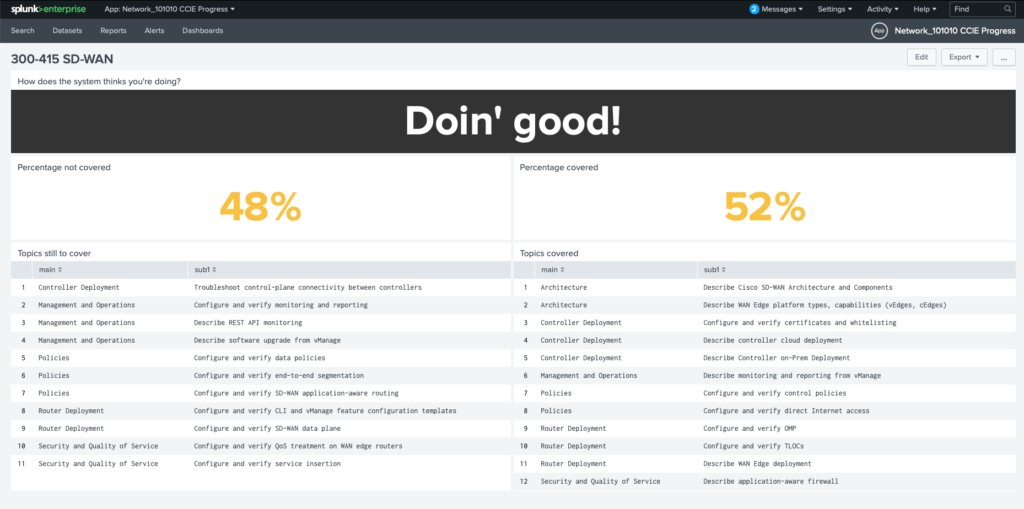
Progress of study:

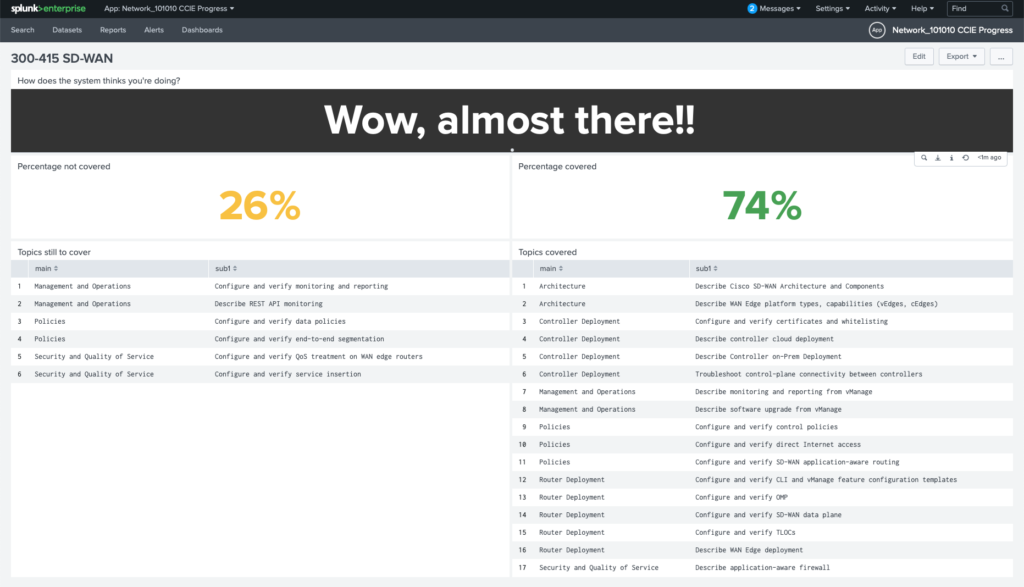
More Progress:

:: Conclusion
It’s not the best work I’ve done so far, but it meets the requirement of a Status dashboard. I’m considering doing this for my CCIE EI study as well and adding a time chart to view historical progress as well. It’s version 1.0. How knows what version 3.1 brings 😉
